SAINT LEO, FL – The most recent national and Florida survey conducted by the Saint Leo University Polling Institute (http://polls.saintleo.edu) from August 10 through August 16 included a substantial number of questions on attitudes toward gun control as part of the institute’s regular yearly schedule of topics, and the institute is making the data available to journalists and the public ahead of the previously planned publishing schedule, given the reporting needs created by the shooting Sunday, August 26, in Jacksonville, FL. Additionally, the polling institute notes this advisory includes data on this topic from prior years of polling, allowing comparisons to see if opinions changed.
Nationally, the institute collected responses from 1,000 individuals, meaning the margin of error for findings is plus or minus 3 percentage points. In the parallel survey of Florida, 500 people were polled, with the margin of error for responses at plus or minus 4.5 percentage points.
- One notable finding is that both nationally and in Florida, sentiment that there should be no control over firearms has incrementally increased from 2016, when 12.6 percent of national respondents said there should be no restrictions on gun ownership, compared to 16.2 percent in the recent survey. In Florida in 2016, 9.6 percent of respondents said there should be no controls, compared to 16.8 percent earlier this month.
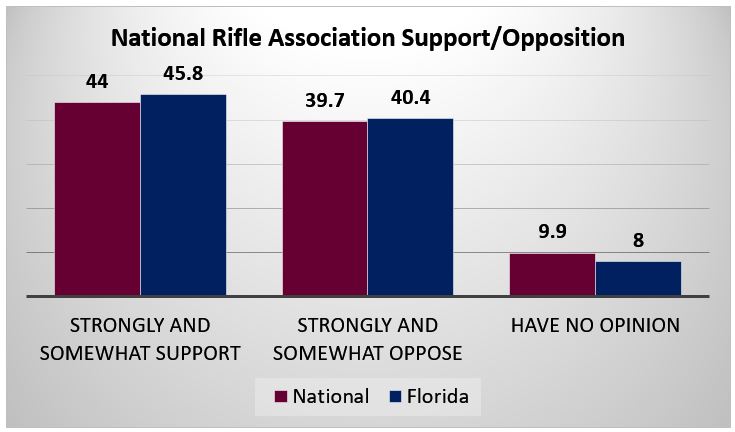
- In a new question this year, the institute asked people about the National Rifle Association, and “How strongly do you support or oppose the association and its positions? A divide was clear, nationally and in Florida, with the strongest sentiments particularly apparent.
| Support/oppose NRA and how strongly | National % Sample of 1,000 |
Florida % Sample of 500 |
| Strongly support | 24.9 | 25.2 |
| Somewhat support | 19.1 | 20.6 |
| Combined support | 44 | 45.8 |
| Somewhat oppose | 14.1 | 13.4 |
| Strongly oppose | 25.6 | 27 |
| Combined oppose | 39.7 | 40.4 |
| No opinion | 9.9 | 8 |
MORE RELATED DATA FOLLOWS BELOW OUR METHODOLOGY STATEMENT. Our media contacts can provide even more specific findings upon request, and interviews. The polling institute was founded by Saint Leo University (www.saintleo.edu), based in Florida.
Media contacts: Jo-Ann Johnston, Saint Leo University, University Communications jo-ann.johnston@saintleo.edu or (352) 588-8237 or (352) 467-0843 (cell/text).
Mary McCoy, Saint Leo University, University Communications mary.mccoy02@saintleo.edu or (352) 588-7118 or (813) 610-8416 (cell/text).
METHODOLOGY: The poll sampled opinions of 1,000 adults nationally approximately proportional to state population. The survey was conducted August 10 through August 16. 2018. The poll has a +/- 3.0 percent margin of error a 95 percent confidence level (on a composite basis). The poll also sampled opinions of 500 Florida respondents during the same timeframe and using the same method. The poll has a +/- 4.5 percent margin of error at a 95 percent confidence level (on a composite basis) with questions asked of all 506.
All surveys were conducted using an online survey instrument.
The Saint Leo University Polling Institute conducts its surveys using cutting-edge online methodology, which is rapidly transforming the field of survey research. The sample is drawn from large online panels, which allow for random selections that reflect accurate cross sections of all demographic groups. Online methodology has the additional advantage of allowing participants to respond to the survey at a time, place, and speed that is convenient to them, which may result in more thoughtful answers. The Saint Leo University Polling Institute develops the questionnaires, administers the surveys, and conducts analysis of the results. Panel participants typically receive a token incentive—usually $1 deposited into an iTunes or Amazon account—for their participation.
ADDITIONAL DATA AND CHARTS: Gun Control
The survey included a question designed to collect personal positions and beliefs about gun control. Nearly two-thirds, 65.9% — down from 71.8% in 2017, of all respondents could see some limited licensing, permitting or some restrictions on certain arms. Results are presented in the following table.
The belief that there should be no regulations or gun controls increased nationally and significantly in Florida.
| Position on Gun Control |
% 2016 National | % 2017 National | % 2018 National | % 2016 Florida | % 2017 Florida | % 2018 Florida |
| There should be no regulations or controls on any firearms | 12.6 | 13.1 | 16.2 | 9.6 | 10.2 | 16.8 |
| There should be some limited licensing, permitting or some restrictions on certain arms such as assault weapons | 74.9 | 71.8 | 65.9 | 76.2 | 74.2 | 69.2 |
| Firearms should not be owned privately | 8.1 | 9.6 | 12.3 | 7.8 | 10.6 | 10.2 |
| Unsure | 4.4 | 5.5 | 5.6 | 6.4 | 5.0 | 3.8 |
Respondents were asked which of several positions best reflected their own personal position toward gun ownership and gun regulation given the number of mass shootings nationwide. Results are presented here.
| Given Recent Mass Shootings – Current Position | 2016 National % | 2017 National % | 2018 National % | 2016 Florida % | 2017 Florida % | 2018 Florida % |
| I continue to support gun ownership rights under the 2nd Amendment without exception and believe these mass shootings would be less frequent/horrific if more citizens were armed | 27.2 | 23.0 | 26.0 | 25.0 | 26.6 | 25.6 |
| I continue to support gun ownership rights under the 2nd Amendment without exception BUT don’t believe in an effort to arm more citizens | 16.3 | 15.9 | 16.6 | 13.2 | 16.2 | 16.2 |
| I support gun ownership rights but am open to more exceptions, regulations and restrictions | 42.6 | 45.0 | 38.8 | 47.2 | 40.8 | 43.2 |
| I continue to oppose private ownership of firearms | 7.2 | 9.5 | 12.1 | 8.6 | 11.0 | 9.8 |
Respondents were asked which firearms, if any, they owned. While 57.6% (down from 66.2% in 2017) indicated “none”, the remainder had one or more types of firearms. Ownership of firearms, overall, appears to have increased somewhat since 2015. Multiple responses were accepted.
| Firearms Owned | % 2015 National | % 2016 National | % 2017 National | % 2018 National | % 2015 FL | % 2016 FL | % 2017 FL | % 2018 FL |
| Hand gun(s) | 23.4 | 25.2 | 26.1 | 30.8 | 23.5 | 25.2 | 28.1 | 33.6 |
| Rifle(s) | 17.7 | 18.3 | 15.1 | 17.6 | 13.3 | 13.2 | 13.6 | 17.2 |
| Assault weapon(s) | 5.6 | 4.0 | 5.9 | 10.6 | 2.9 | 4.4 | 5.2 | 10.0 |
| Shotgun(s) | 15.9 | 16.6 | 12.5 | 16.1 | 12.7 | 12.6 | 13.0 | 15.0 |
| None | 66.7 | 64.5 | 66.2 | 57.6 | 69.0 | 67.0 | 63.3 | 56.2 |
| Unsure | 1.6 | 2.1 | 1.9 | 3.4 | 1.7 | 3.8 | 1.8 | 2.4 |
Respondents were asked how safe they might feel in a number of different situations. Each was asked to rate their perceived safety in each situation using a scale of one to ten where one was very safe and ten was not at all safe. The following table presents the cumulative totals for safe (ratings of 1-4) and the cumulative totals for unsafe (ratings of 7-10).
National Percentages
| Firearm Situations | 2016: US Safe (1-4) % | 2016: US Unsafe (7-10) % | 2017: US Safe (1-4) % | 2017: US Unsafe (7-10) % | 2018: US Safe (1-4) % | 2018 US Unsafe (7-10) % |
| If you had a firearm with you in public | 49.8 | 19.8 | 41.6 | 31.8 | 41.8 | 32.0 |
| If police were not armed | 13.9 | 72.0 | 18.3 | 63.1 | — | — |
| If others, around you in a public place, were armed | 32.0 | 44.1 | 29.7 | 47.1 | 34.0 | 41.2 |
Florida
| Firearm Situations | 2016: Florida Safe (1-4) | 2016: Florida Unsafe (7-10) | 2017: Florida Safe (1-4) | 2017: Florida Unsafe (7-10) | 2018: Florida Safe (1-4) | 2018: Florida Unsafe (7-10) |
| If you had a firearm with you in public | 48.4 | 23.8 | 48.0 | 25.8 | 50.4 | 25.0 |
| If police were not armed | 15.8 | 69.2 | 26.6 | 59.6 | — | — |
| If others, around you in a public place, were armed | 32.8 | 40.0 | 34.6 | 41.8 | 40.8 | 36.4 |
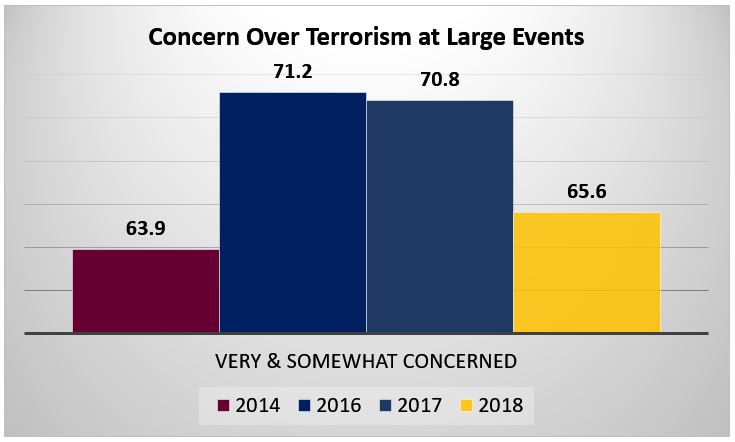
LARGE EVENTS
In 2014, 2016, 2017 and again, within this 2018 poll, respondents were asked how concerned they were about terrorism when attending large public events in the United States. Concern has remained constant over the past year. Results are displayed in the following graph.
National Percentages

Florida percentages on large events
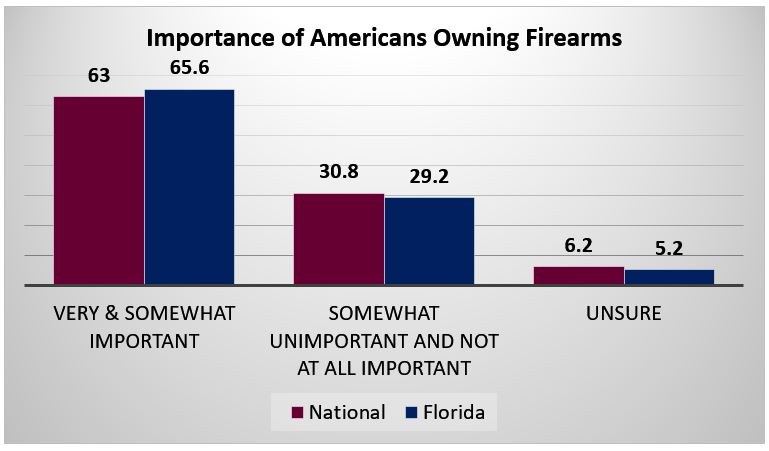
MORE ON FIREARMS AND PERSONAL STANCES
In another question, were asked how important or unimportant they believed it is for Americans to own firearms. The following graph displays the cumulative totals for very and somewhat important as well as somewhat unimportant and not at all important both nationally and within Florida.
NRA
Support for the National Rifle Association (NRA) was measured in a new 2018 question. The following graph depicts the results collected. The cumulative totals for strongly and somewhat support as well as strongly and somewhat oppose are presented for national and Florida poll participants.